Sunday, January 13, 2019

Evaluate Reflection

Evaluate Reflection

Answer in a complete paragraph response:
  1. How has the Evaluate module prepared you to meet each standard listed above? Link to or provide specific examples from your work in Evaluate. 


  • Standard D: The online teacher promotes student success through clear expectations, prompt responses, and regular feedback.

    Hello Everyone, I wanted to talk about lesson 8.09. I know that some of you are not there yet but this applies to all AP CS A students once they get to the javaDoc statements

    This lesson is on how to create JavaDocs. It is an important lesson in that it shows you how to comment your methods, classes and programs.

    I will not accept any programs without the proper Comments which include JavaDocs. If you turn in programs without the proper documentation I will be sending them back to you for a retry. Please watch the following video.
    https://youtu.be/SpJNdLh8WXI 


  • Standard G: The online teacher demonstrates competencies in creating and implementing assessments in online learning environments in ways that ensure validity and reliability of the instruments and procedures.

    https://lsnossevaluate.blogspot.com/2019/01/evaluate-1-summative-assessments.html


  • Standard H: The online teacher develops and delivers assessments, projects, and assignments that meet standards-based learning goals and assesses learning progress by measuring student achievement of the learning goals.

    https://lsnossevaluate.blogspot.com/2019/01/evaluate-2-data-driven-instruction.html


  • Standard I: The online teacher demonstrates competency in using data from assessments and other data sources to modify content and to guide student learning.

    https://lsnossevaluate.blogspot.com/2019/01/evaluate-3-personalized-teaching-and.html
  1. What strategies will you take away from the Evaluate module and apply to your teaching?   
How to use personalized learning with data
The strength of great feedback

  1. What lessons were most beneficial for you?
Data driven assessments
Quality feedback


Criteria C - Data Driven Instruction and Analytics: Describe the ways in which instructors who utilize data have an advantage over those who do not.


Criteria E - Self-Reflection on Teaching Abilities: Include at least one screenshot of a teaching artifact showcasing your individual weaknesses. Be sure to include artifacts such as evaluation feedback, personal reflections, e-portfolio links, professional growth plans, and anything else that showcases introspection into your weaknesses as an online educator.

Creating good resources for debugging a program.


Critera F - Evaluate Reflection: Discuss tools and strategies learned within Evaluate that can be applied in your personal teaching methods.

Using different tools to evaluate students.
Using and creating rubrics
03.09 Challenge Program Grading Rubric


ComponentsPoints
Possible
Points
Earned
Comments include name, date, and purpose of program.11
User clearly prompted to provide input.22
Scanner class method(s) used to accept user input.22
Parsing methods used to create primitive data types.22
Arithmetic expression(s) syntactically correct.22
String method(s) used correctly.44
No compiler or runtime errors.22
Output is correct and neatly formatted.44
Thoughtful PMR included.11
Total2020


100


Using Snagit and showing the students how to use it for a different kind of evaluation.


Using Socrative and Kahoot! for a fun evaluation


 Critera F - Evaluate Reflection: Reflects on teaching, and shares which lessons from Evaluate will be most beneficial to you as an instructor in the online teaching environment.

Using different ways to evaluate student work.


I use Analytics in Youtube to see if I need to make more on a topic or redo.  I can also look at the comments.


Data driven assessments
Quality feedback

Evaluate 3 - Self Reflection

Evaluate 3 - Self Reflection

 Artifact: Submit evidence of reflection on your individual teaching abilities. Include a minimum of (2) two artifacts: evaluation feedback, your own reflections, e-portfolio links, professional growth plans, recommendation letters, stakeholder feedback and anything else that showcases introspection into strengths and weaknesses as an online educator and document all in your individual blog.

Two Artifacts


From this sample I could see that students were having trouble in this section. Maybe my feed back was not specific enough, maybe the online lessons did not give enough examples. I decided that i needed to make some videos on this material.

My Strengths - 
  • Looking for students that are pacing poorly or scoring poorly and communicating with them.
  • Looking at scoring tendencies and creating videos, activities, FAQ's and how to's. Posting these in a common area such as Announcements and sending out to students.
  • Looking at students pacing and sending them needed information about end of unit or end of course tests.
  • Organization - I have spreadsheets of problem feedback, Youtube lists for each course, logs of communication sent to parents, emails organized into folders for quick review when needed.
  • Feedback - I have feedback for every problem in my courses. This feed back is particular to each problem and organized in spread sheet form for every assignment.  Picture of one below:


 Example of feed back


XXX, You did well on this assignment. Please read and use the notes below. Retry this assignment if you think you can improve your grade. Be aware that the computer takes the LAST grade, not the best grade. - Mrs. Noss

#3 A car travels 100 meters in 5 seconds. What is the speed of the car?
speed = distance over time ; 1 mile = 1609 meters (2 points)

Since all answers are in miles/hour we need to convert all measurements to miles and hours.

100 meters / 1609 = 0.0622 (rounded)
5 / 3600 = 0.00139 (rounded)

speed = distance / time = 0.0622/0.00139 = 44 .7 mph


Video artifact displaying a strength:
https://www.youtube.com/playlist?list=PLIWQ43js_97EujtTYuQLI9YP2am_aQHBZ   - youtube on difficult subject for students.

Weaknesses -
  • Calling student families - I much rather communicate by email or message text
  • Giving students too much information too soon
  • Not creating enough resources on Logical debugging
 
Ms. Noss,

I also wanted to let you know about a few things. Other than the “Ghosts” program, I still have the assignments from Iterating Over An Array (Lesson 4). If you could look at the heads and tails activity to give me an idea of what I’m doing wrong, that would be great. I also have the simulation activity. I’m not exactly sure how to approach that one either…since it was not really explained in the video. Other than that, I just need to take the unit test and I will be all done. Just wanted to let you know and ask if you could help me out with these few assignments.

Thanks so much,
google voice:

XXX has been working in CodeHS but not submitting your assignments to BUZZ, the learning system we use. In order to get credit for your work you MUST submit your work in BUZZ. Please read the email that I have sent and watch the video describing how to get credit for his work.


Evaluate 3 - Personalized Teaching and Learning

Evaluate 3 - Personalized Teaching and Learning


Artifact: Provide sample data from student results for a course within your field. The data can be entirely theoretical and written out in text form.

The following is a math heat map of skills


 From this map I can see where the student is performing well (Dark blue) and where he/she has not done any work or needs improvement.  In the  course you can click on any of the squares to go to that lesson or see what is missing

Given this type of information I can set up a course of action for the student. I can then check on them and see their progress.


Create: Examine your sample student performance data. Create an action plan that you would implement in your classroom to personalize teaching and learning.  Provide both a class and individual approach in your plan.

Using the heat maps the teacher could create a series of lessons that the student should be looking at. Each student can have individualizes lessons learn.

For those lessons that appear in many heat maps of students additional content and activities could be used. Videos could be made, announcements could include FAQs.

By combining the commonly difficult lessons with individualized lesson each student can have their personal learning path

I have click on some of the squares that are not dark blue and  set up a lesson for this student.

Evaluate 2 - Competencies

Evaluate 2 - Competencies

Create: For this section, set up a competency structure using standards for one unit of your sample course. Associate the assignments in that unit with the competency.\

14 Classes Revisited Object-Oriented Program Design
  • Apply functional decomposition: IA6
Program Implementation
  • Constant declarations: IIB2a
  • Java library classes (Integer and Double): IIC
AP Computer Science Lab Student Guide: Picture
  • Calculate prime numbers
  • Perform a frequency analysis on a passage of text
  • Encode and decode a secret message using a Caesar shift
  • AP Computer Science Lab: Picture
  • Challenge Exam Modules 13–14
OOP—Class Definitions Revisited
  • Multiple Constructors 1, 2
  • Overloaded Instance Methods
  • Integer and Double
  • public and private 1, 2
  • Class Methods 1, 2, 3 Class Variables and Constants 1, 2, 3
  • final Block Variables
  • Object aliasing 1, 2, 3
  • Using this 1, 2, 3, 4
  • Test 16
Rubric

14.03 Class Variables and Constants

Competency
ComponentsPoints PossiblePoints EarnedEncode and decode a secret message using a Caesar shift
Comments include name, date, and purpose of the program.11 IA6
Menu provided to choose encryption, decryption, or quit.22
Alphabet declared as a class constant.20Constant
Shift key declared as a class variable.10
Static method used to generate cipher alphabet.44Java library classes
User prompted to enter a plaintext message.11
Static method used to encrypt plaintext message.44Multiple Constructors 1, 2
Static method used to decrypt encrypted message.44Multiple Constructors 1, 2
Output is correct.33
No compiler or runtime errors.22
Thoughtful PMR included.10
Total2521


84
There were no class constants


There were not class variables


Evaluate 2 - Data Driven Instruction & Analysis

Evaluate 2 - Data Driven Instruction & Analysis

Reflect: Review the (9) nine data image artifacts from this lesson on student enrollments, student progress, communication and feedback in the course.

What can you learn about the hypothetical instructors course from each of the (9) nine data images?


Enrollment and attendance

This screen shows how much time the students (weeks) have put into the course. The teacher can look at this, check their pacing and their grade and recommend changes as needed.


Pacing
Students not moving at the recommended pacing can face some stressful and often unproductive time towards the end of the course. The chart below shows that some students worked everyday and others took 'time off' and then tried to complete the course at the end of the session
Teachers feedback 
This example shows teacher feedback within the assignment. The teacher used the grade from the lesson to determine how to give constructive feedback.


Students using feedback for reflection

After teacher feedback has been given the student can self reflect on where they can improve or go back and edit the lesson. Self reflection is important for the student to do so they may make decisions about their learning

Overall
By looking at different data teachers can self-reflect on the pacing of the lesson and decide if it is too fast or slow, They then can make adjustments to the course.  Student reflections will often help with the content. if the material is too hard or not presented well then the reflections will often indicate this.

Some ideas that would be used in online instruction. Looking at the data:
  • Create videos for the more difficult content
  • Create how to's or examples
  • Create a discussion post that directs the student thinking into a desirable direction
  • Design additional activities the scaffold content
  • Create FAQ list 


Evaluate 1 - Summative Assessments

Evaluate 1 - Summative Assessments

Post in your blog: An assessment created and include what method was used to assess the validity, reliability, and security.

Questions
1.
(03.02 MC) The table below shows the squares of different numbers:
Number
(x)
2 −2 3 −3
Square of the number
(y)
4 4 9 9


Part A: Does the table represent y as a function of x? Justify your answer. (5 points)
Part B: The total cost f(x), in dollars, for renting a rowboat for x hours is shown below:
f(x) = 20 + 3x
What is the value of f(150), and what does f(150) represent? (5 points)
(10 points)
Part A: Yes it does because y is dependent on x.

Part B: $470.
/ 10
2.
(03.06 MC) Sam is observing the velocity of a car at different times. After two hours, the velocity of the car is 54 km/h. After four hours, the velocity of the car is 58 km/h.
Part A: Write an equation in two variables in the standard form that can be used to describe the velocity of the car at different times. Show your work and define the variables used. (5 points)
Part B: How can you graph the equation obtained in Part A for the first six hours? (5 points)
(10 points)
Part A: x=starting point for the measurement.  y=the amount of hours measured.  v-final velocity.  x + 1y = v

Part B: If x is 54 km/h then 54 + 6 + 60.
/ 10
3.
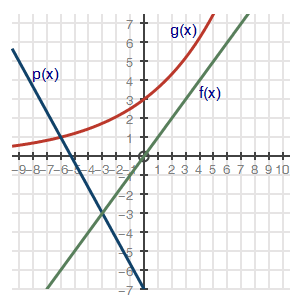
(05.02, 5.03 MC) The graph shows the functions f(x), p(x), and g(x):
'Graph of function g of x is y is equal to 3 multiplied by 1.2 to the power of x. The straight line f of x joins ordered pairs
Part A: What is the solution to the pair of equations represented by p(x) and f(x)? (3 points)
Part B: Write any two solutions for f(x). (3 points)
Part C: What is the solution to the equation p(x) = g(x)? Justify your answer. (4 points)
(10 points)
Part A: (-3, -3)

Part B: (0, 0)

Part C: (-6, 1)
/ 10
4.
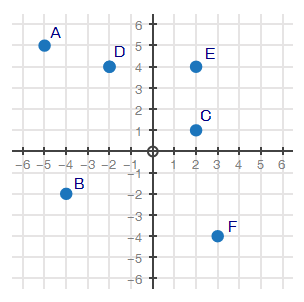
(05.06 HC) The coordinate plane below represents a city. Points A through F are schools in the city.
graph of coordinate plane. Point A is at negative 5, 5. Point B is at negative 4, negative 2. Point C is at 2, 1. Point D is at
Part A: Using the graph above, create a system of inequalities that only contain points D and E in the overlapping shaded regions. Explain how the lines will be graphed and shaded on the coordinate grid above. (5 points)
Part B: Explain how to verify that the points D and E are solutions to the system of inequalities created in Part A. (3 points)
Part C: Timothy can only attend a school in his designated zone. Timothy's zone is defined by y < 3x − 3. Explain how you can identify the schools that Timothy is allowed to attend. (2 points)
(10 points)
Part A: y < x and y > -2x

Part B: Point B verifies it.

Part C: y > 1/2x
/ 10

Methods for validity

  • Time limit
  • A large question data base
  • Other webpages unavailable

Answer in your blog:
What process was used to determine the validity, reliability, and security of the assessment?
Blocking off other webpages
Looking at turnit in for Free response
Limiting the number of tries. 

What was the result?
Students can display a master of the subject area.

Evaluate 1 - Quality Feedback


Evaluate 1 - Quality Feedback


Student work sample


Questions
1.
(01.05)
A square has a side of 6.25 feet. What is the area in square feet? Round to the correct significant digits. (2 points)
/ 2
2.
(01.05) The average number of rainy days in Seattle, Washington is listed below:
Month January February March April
Rainy days 18 16 17 14
If the data was only accurate to the tens place, which month's rainy day total would be different from the others? (2 points)

January

February

March

April
/ 2
3.
(01.05) Which of the following best represents the average rate at which a person can quickly walk? (2 points)

3 steps per hour

3 steps per second

30 steps per minute

30 steps per second
/ 2
4.
(01.05) Which of the following is the most appropriate unit to describe the rate at which people are entering a theme park? (2 points)

Hours per person, because the dependent quantity is the hours

Hours per person, because the dependent quantity is the people

People per hour, because the dependent quantity is the hours

People per hour, because the dependent quantity is the people
/ 2
5.
(01.05) Which of the following is the most appropriate unit to describe the rate at which a person reads? (2 points)

Minutes per word, because the independent quantity is the minutes

Minutes per word, because the independent quantity is the words

Words per minute, because the independent quantity is the minutes

Words per minute, because the independent quantity is the words

  Feedback


You need to try this assignment again. Please read the notes below and watch the video for this section.  Then you can redo the problems. - Mrs Noss

http://XXXXXXX

#3 Your problem is similar to this: Which of the following best represents the average rate at which a person can quickly walk? What two things are we comparing?
It looks like time and the number of steps it takes.

So which is the dependent variable?
Does the amount of steps depend on the amount of time you drive the car or does the amount of time depend on the the amount of step?
Well, assuming that you are going to arrive at your chosen destination, the amount of steps depends on the amount of time you walk. Time is the independent variable and steps is the dependent variable.


Answer in your blog:
Why is it important for an instructor to consider student performance data when providing feedback?
 If you look over their data you might see a trend in the misunderstanding
You can also see the time spent on an assignment and recommend that they spend more time
You can look at each problem and give examples or explanations to improve their score

How can feedback be both observational and instructional?
Observational could be the amount of time they spent or the quality of their work.
Instructional would be if a student consistently was not able to do a certain task over several problems or assignments.